

5 systems consolidated into true margin per deal
At a glance
- Sales, operations, marketing, finance, and recruiting data from 5 systems unified into BigQuery
- A full funnel model connecting Meta ad spend to closed installations and true cost per deal
- Per agent performance and cancellation rates now visible before they become a pattern
Vero by Datum Labs built the full-funnel margin model for this client. Voltera is a full-cycle solar sales operation based in the Netherlands, running Meta Ads campaigns through to physical installation. Voltera manages leads, commissions, procurement, and back office costs across a multi-person sales team closing deals at scale.
Voltera runs a full sales operation from Meta Ads to signed quote to physical installation. Every closed deal earns commission, costs procurement and back office time, and either becomes profitable or quietly does not. The team could see the deal closing. They could not see what it actually earned.
The CRM tracked quotes and closes. The SQL Server ERP managed installation and procurement. Meta Ads ran the campaigns. Moneybird held the invoices. Each system was doing its job. But true margin existed in the gap between all of them, and that gap was where Voltera's real numbers were hiding.
The Problem With Margin Spread Across 5 Systems
As deal volume grew, so did the cost of not knowing which deals were actually worth closing. The team needed to trace ad spend to closed installations, attribute every cost component per deal, and see which closers were driving revenue versus which were driving cancellations.
Answering any of those questions meant pulling five exports by hand. So it almost never happened, and decisions kept getting made on gross quote value instead of real profit.
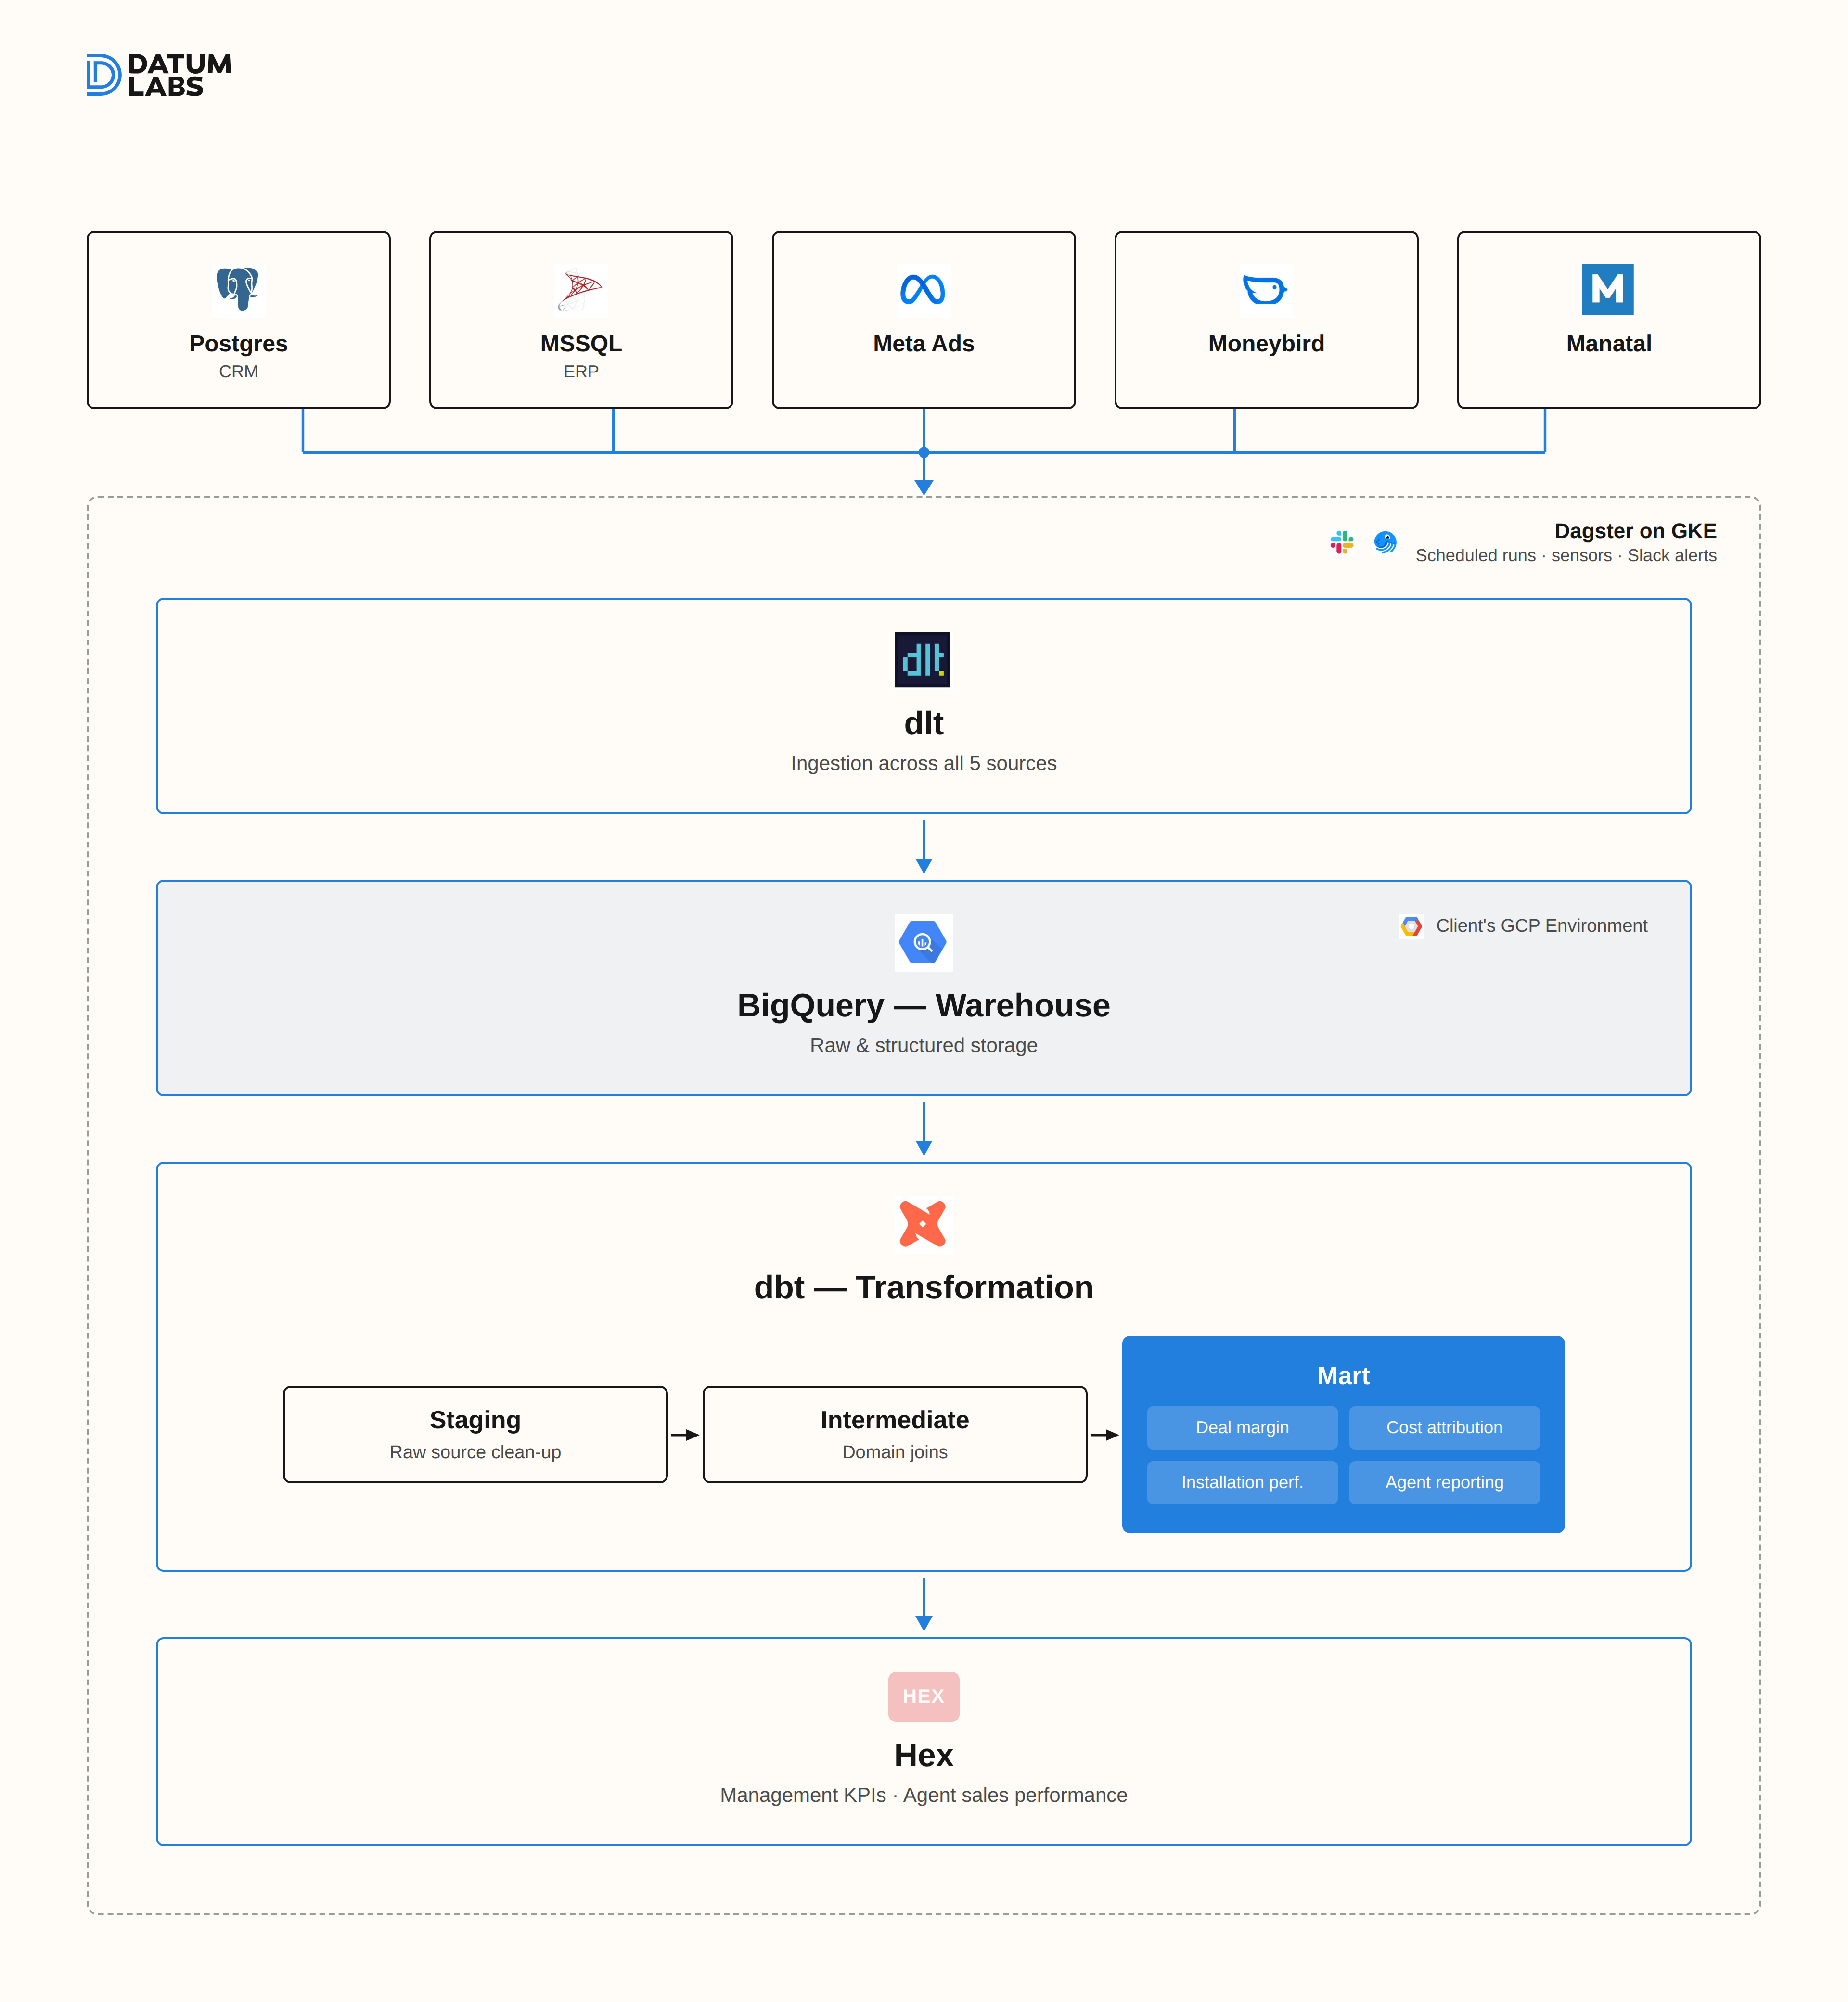
Every system Voltera relied on, connected into one warehouse:
Five systems, each working in isolation. Without a warehouse joining them, true margin was a number nobody could produce until the month was already over.
Why the Standard Answer Did Not Fit
Hiring a data engineer to connect the CRM and ERP is the obvious move. It is also the slow one. A new hire needs months to ramp up and still only owns one layer of a five-system funnel, with no team behind them when something breaks.
Voltera did not need a headcount. They needed a foundation built fast, deployed on their own infrastructure, by a team that had built this exact funnel model before.
What Vero Built?
Five systems, one warehouse, every pipeline running on a 15-minute cadence so sales activity reflects reality rather than a day-old export.
- dlt connects all 5 sources with schema evolution built in, so new fields in the CRM or SQL Server ERP are absorbed automatically without breaking downstream reports
- BigQuery is the single warehouse where sales, operations, and marketing data live side by side
- dbt staging models clean each source independently, intermediate models join closes to installation, procurement, and ad spend, mart models surface true margin per deal with every cost component attributed
- Dagster on GKE runs every pipeline on schedule with sensors and Slack alerts on failure
- Hex powers a KPIs Dashboard for management and an Agent Sales Dashboard for each closer, both built on the same modeled data
- Reverse ETL into Synthflow pushes modeled segments back into the sales workflow so the team acts on data without depending on Vero for every new question
How the Rollout Happened?
The build started with the margin model, not the dashboards. Before a single connector was written, the team mapped exactly which cost components mattered per deal and which systems held each one. That mapping defined what the dbt intermediate layer needed to join.
Ingestion came next. All 5 sources flowed into BigQuery, each validated against its origin system, with every pipeline syncing on a 15-minute cadence from the start. Once the data was clean and consistent, the dbt models were built incrementally: staging first, then the intermediate joins across CRM, ERP, and finance, then the mart layer surfacing true margin per deal. The KPIs Dashboard and Agent Sales Dashboard followed as each domain came online and was verified.
The full stack was live in under 2 months, deployed inside Voltera's own GCP environment.
What Changed for the Team?
- True margin is visible for the first time, with revenue, cost, commission, installation, and acquisition modeled together per deal
- Manual reporting is gone. 20 to 25 hours of exports and reconciliation replaced by dashboards refreshing every 15 minutes
- Closers, campaigns, and deals are ranked by actual profit contribution, not close count or lead volume
- Meta Ads spend is tied to closed and installed deal revenue, so budget shifts toward what actually converts
- Ten plus agents each have their own Hex dashboard, with management seeing top performers and cancellation patterns early
Talk to the founders who scope, build, and stay, on.
The data foundation your whole team can work from — built by Datum labs.
Get in touch



Get notified when we publish. The patterns we're actually seeing across real client stacks, not theory.




.png)
.png)
.png)