
Ask AI for a summary about Datum Labs


We turn complex data into clear insights. Our comprehensive data analytics services, from strategy to execution, drive business growth and innovation.
.png)
.png)
.png)
.png)


This AI voice agent company sells call minutes, billed against AI and cloud infrastructure from a dozen separate vendors, across two regions, to 85 active accounts. The team could see the bills coming in and the accounts logging in. They could not see what a single call actually cost, or which of those 85 accounts were quietly heading for the door.
Their individual tools worked well. OpenAI, ElevenLabs, and Deepgram each billed cleanly in their own portal. PostHog tracked engagement. Pylon held support conversations. But nothing connected them, and pricing decisions were being made without knowing the real unit economics behind a single minute.
A voice AI SaaS platform that turns speech into formatted, application-ready text. Launched in 2024 and grew at 40% month-on-month from there. 270 Fortune 500 companies signed. Users generating more than half their typed output through voice within three months of adoption. User base expanded 100x year-on-year.
That kind of growth generates data at pace. Every subscription event in Stripe. Every sales touchpoint in HubSpot. Every acquisition source in GA4. Every product interaction in event data. Every support ticket in a separate tool. Five systems. Five separate definitions of the same business.
The data existed. The problem was that nothing connected it. At 40% month-on-month, that problem compounds faster than most teams expect.
Product-led growth businesses run on a specific set of metrics: activation rate, retention by cohort, trial-to-paid conversion, seat expansion in enterprise accounts, support resolution time. These are not background reporting numbers. They feed the product roadmap, the sales motion, and every growth decision the business makes.
Each of those metrics came from a different system. Activation from product event data. Revenue from Stripe. Pipeline from HubSpot. Acquisition from GA4. Support performance from a separate tool. Getting a complete picture meant pulling from each source manually and reconciling in a spreadsheet.
The reconciliation problem was real. Revenue from Stripe differed from revenue in HubSpot because each system applied different logic. Activation calculated from product data disagreed with the version from GA4 because the definitions were not aligned. Teams making decisions on these numbers were working from different versions of the same metric without knowing it.
At this pace of growth, that misalignment was not a cosmetic issue. It was slowing decisions that needed to move fast.
The tools were not wrong. The issue was that no shared layer existed beneath them.
When metrics are defined inside individual tools rather than in a shared transformation layer, every team builds their own version. Product calculates activation one way. Growth calculates it another. Finance applies different timing logic to revenue than sales does. None of these teams is wrong. They are each working with the data available inside their own system.
The consequence is that cross-team decisions require negotiating which number is correct before the actual decision can start. In a business growing this fast, that friction has a direct cost.
The reporting layer needed a foundation underneath it: one shared warehouse, one transformation layer, one definition per metric.
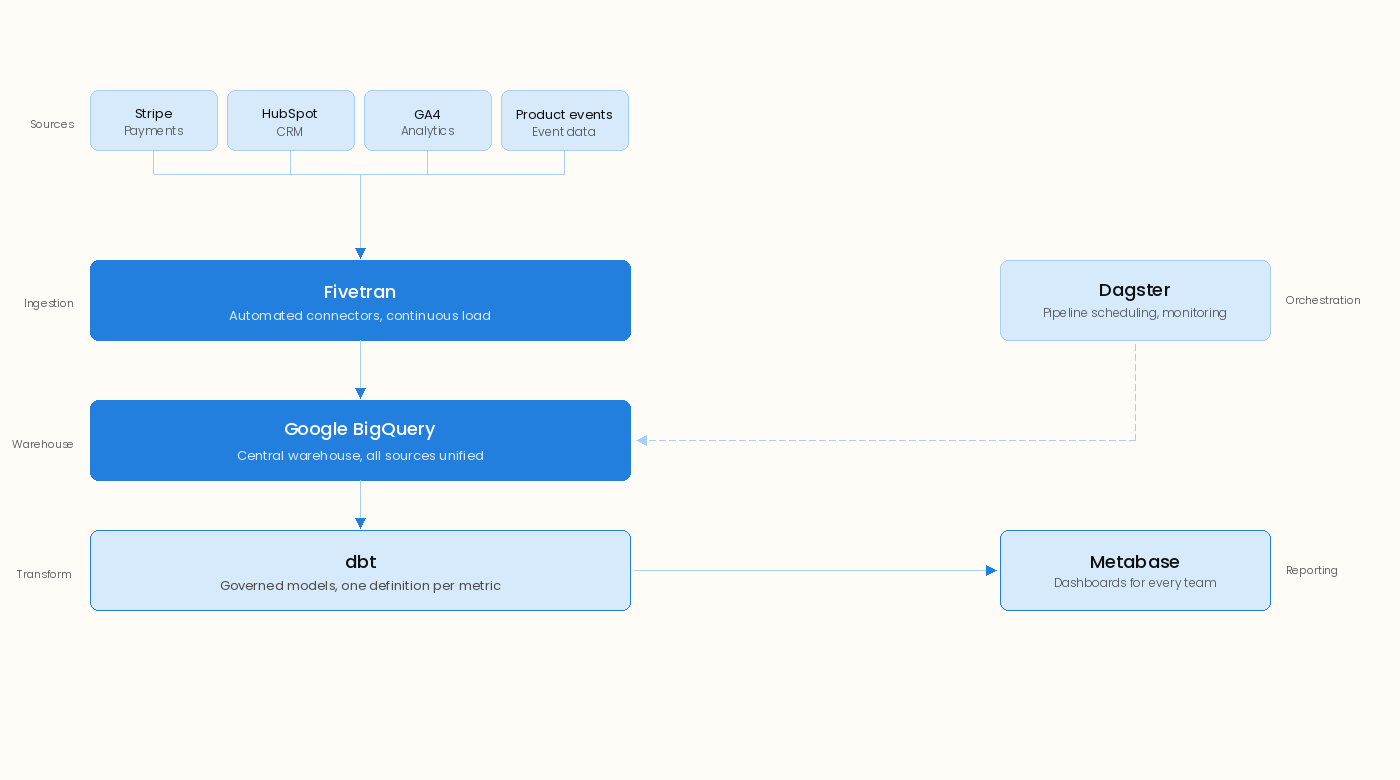
The solution was built on a structured analytics foundation designed for SaaS companies that need consistent, cross-team metrics without adding data engineering overhead to their own team. Datum Labs handled ingestion from all source systems, applied governed transformations, and delivered dashboards that every team trusts because they all draw from the same layer.
Fivetran automated the connection between all five source systems and Google BigQuery. Stripe, HubSpot, GA4, product event data, and support tooling all load into the central warehouse on a continuous schedule. No manual exports. No custom connector code to maintain. Data arrives fresh across all sources without engineering effort from the client team.
dbt handles transformation. Raw data from each source is structured into staging tables, intermediate models, and analytics marts organized by business domain: revenue, activation, retention, marketing, and support. Every metric that matters to this business is defined once in this layer.
Revenue is one number because it is defined in one model. Activation is one definition because it lives in one place. Retention cohorts use the same logic whether the dashboard is owned by product or finance. When a definition needs to evolve, it changes in the transformation layer and propagates to every report automatically.
Dagster orchestrates the full pipeline. It manages dependencies between ingestion runs and transformation jobs, monitors execution, and surfaces failures before they affect dashboards. Every deployment of the dbt project goes through version control and CI/CD. Changes to transformation logic are reviewed before reaching production.
Metabase provides the reporting surface. Dashboards are built for each business function rather than as a single catch-all view. Product tracks activation funnels and feature retention. Growth monitors trial-to-paid conversion by acquisition channel. Sales tracks enterprise pipeline and seat expansion. Support monitors resolution times against SLAs.
All of them draw from the same BigQuery warehouse. The numbers agree because they come from the same source.
The impact lands differently for each team, but the underlying change is the same: one reliable layer replaced five separate systems producing five versions of the same metrics.
Nobody on any of these teams manages infrastructure or exports data manually. The pipelines run automatically. The models update continuously. The dashboards reflect the current state of the business.
New product surfaces, new enterprise features, new markets, and new data sources will all need to connect to the same reporting foundation.
Because the architecture is built on governed models with clean separation between ingestion, transformation, and reporting, adding a new source means a new Fivetran connector and a new staging model. Existing marts do not change. Existing dashboards do not break. The team gets expanded coverage without disruption.
For a SaaS company at this pace, that extensibility is not optional.

Ask AI for a summary about Datum Labs
We turn complex data into clear insights. Our comprehensive data analytics services, from strategy to execution, drive business growth and innovation.