
Ask AI for a summary about Datum Labs


We turn complex data into clear insights. Our comprehensive data analytics services, from strategy to execution, drive business growth and innovation.
.png)
.png)
.png)
.png)


As Amanahfy’s user base grew, so did the complexity of the questions they needed to answer. Simple dashboard metrics were no longer enough. The team wanted cohort comparisons across custom date ranges. They wanted multi-step funnel analysis segmented by plan type, acquisition channel and onboarding path. They wanted to track monthly active users broken down by feature area and correlate that with revenue expansion.
These are not exotic questions. They are standard product analytics questions. But answering them reliably required a data foundation that their existing setup could not provide.
The core issues were:
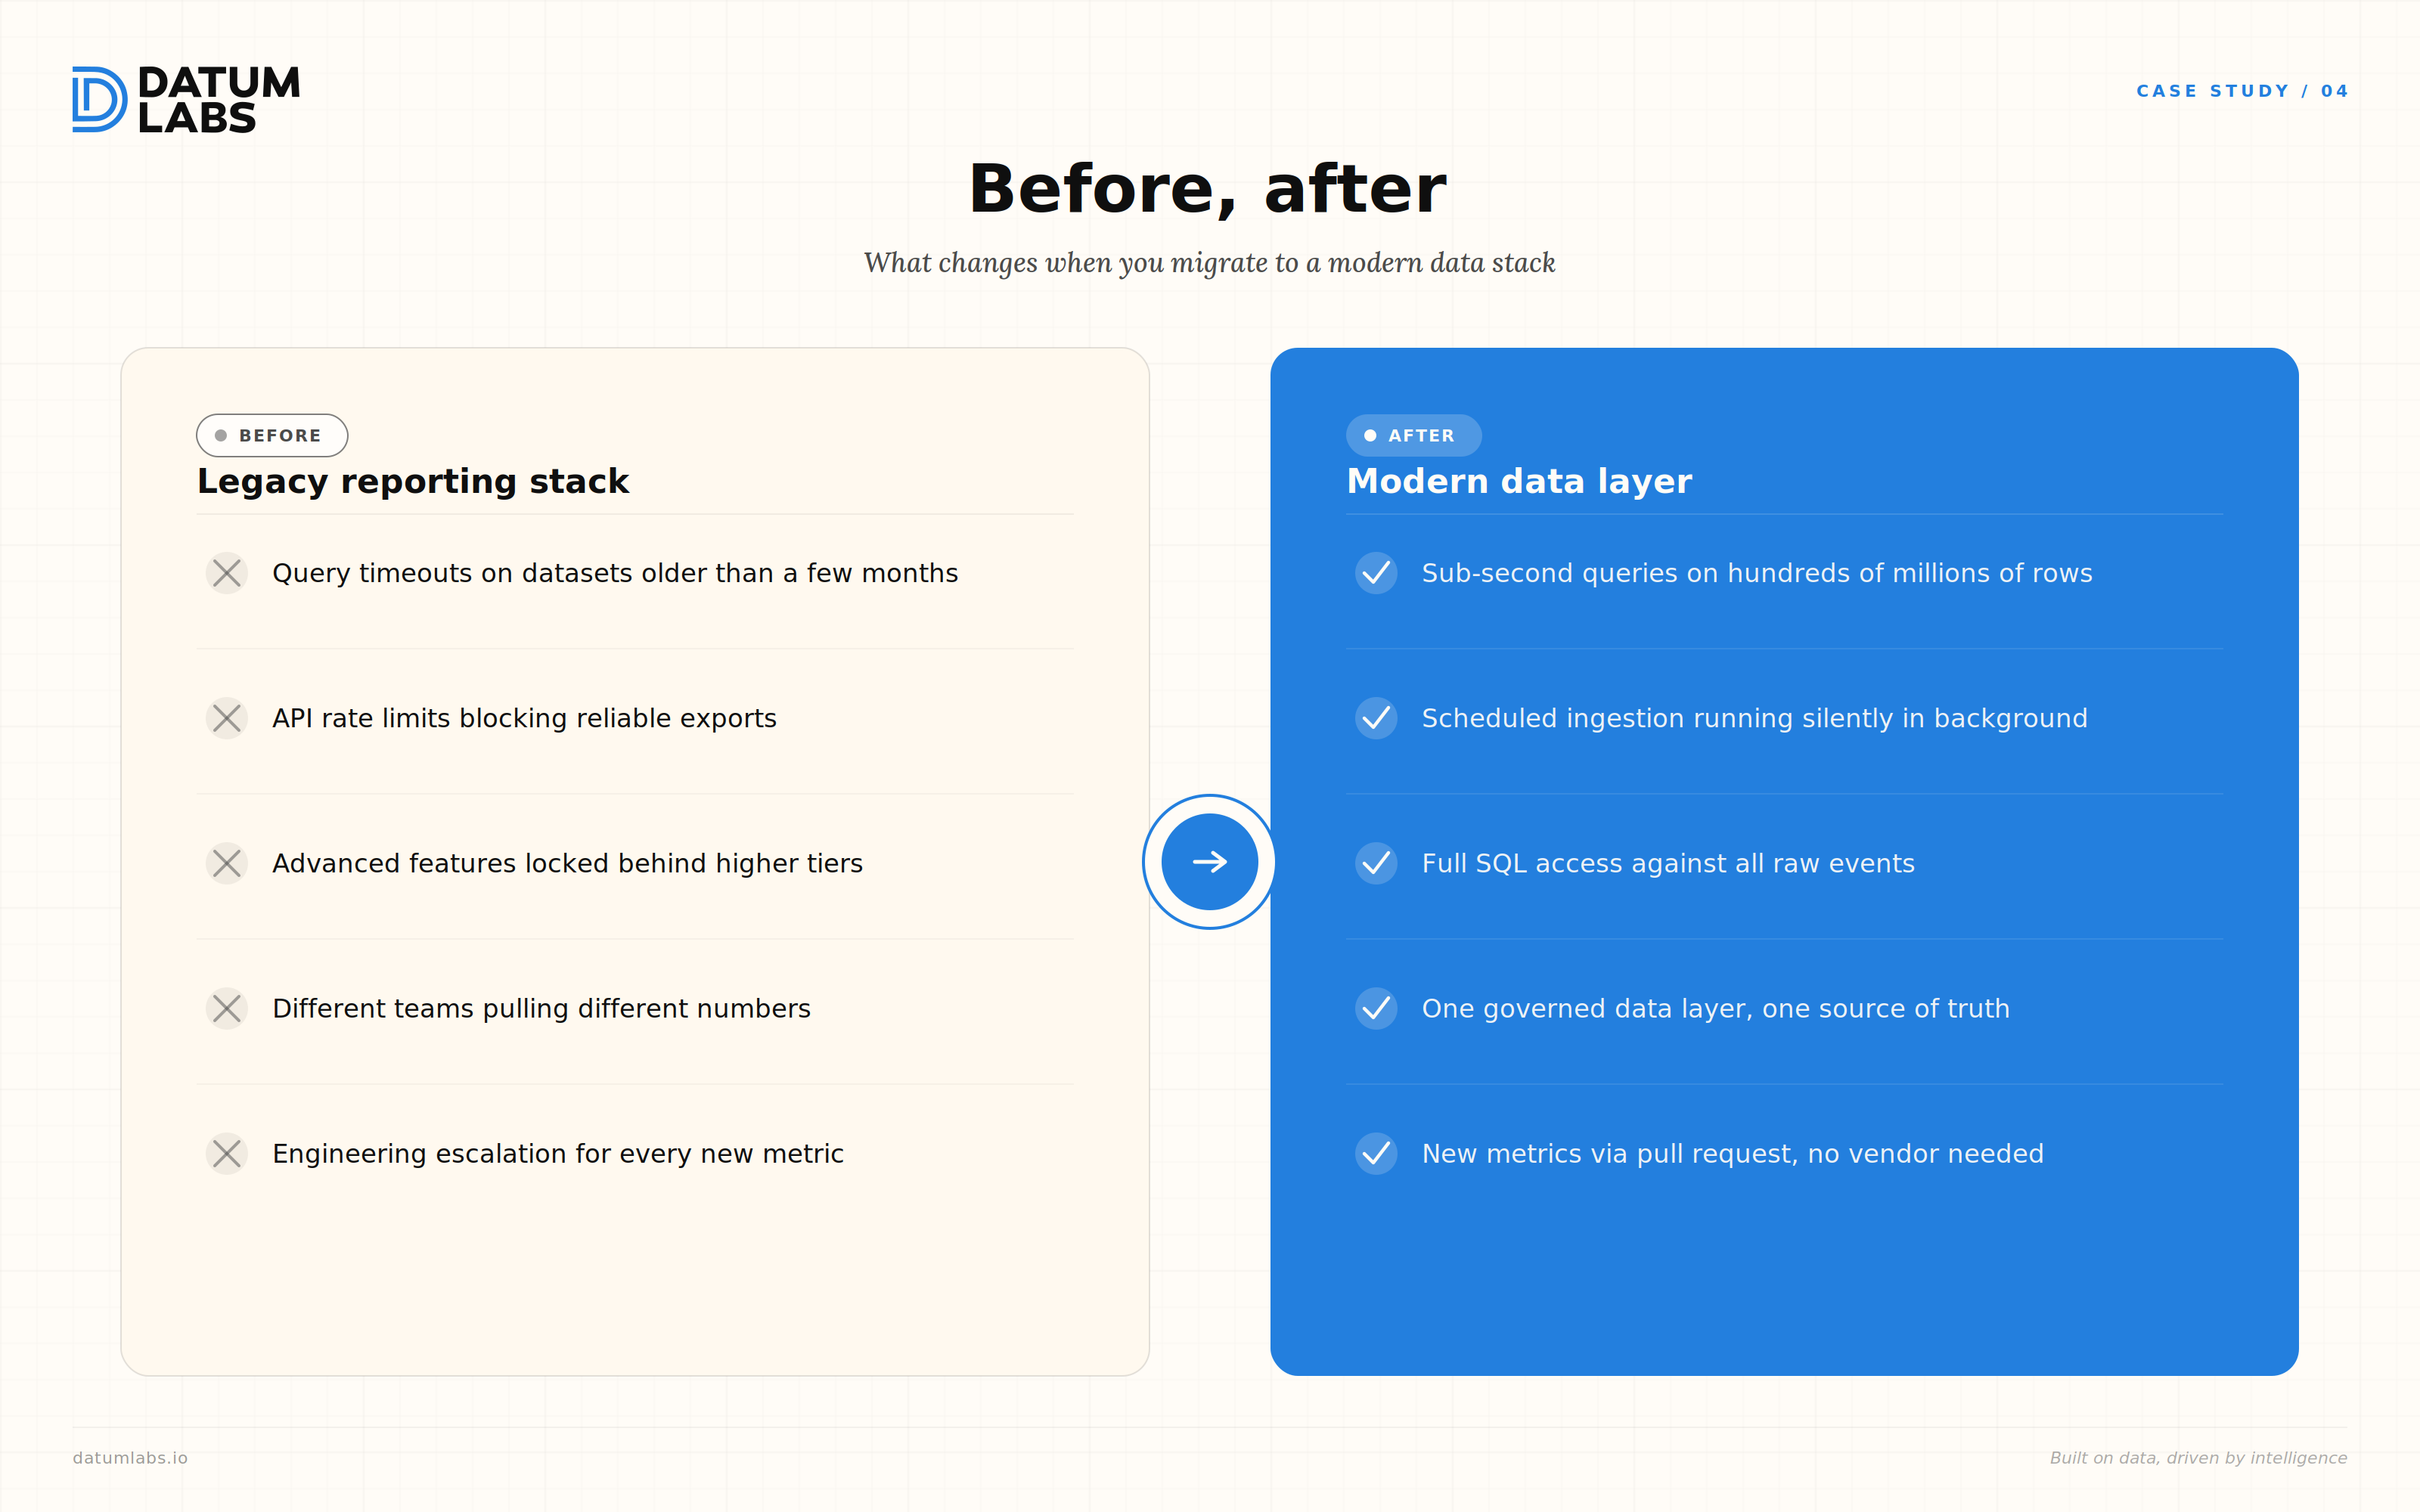
The data existed. The problem was infrastructure. Without a proper warehouse underneath, every analytical question required a workaround. And workarounds do not scale.
The instinctive response to this kind of problem is to reach for an enterprise data warehouse. Spin up a managed cloud warehouse, configure a connector to pull event data, build a transformation layer, connect a BI tool. That stack works. Many companies run it successfully.
But for a product team at Amanahfy’s stage, that path came with tradeoffs that did not make sense. Enterprise warehouse contracts carry significant cost before you have proven the value. Connector configurations require ongoing maintenance. Transformation pipelines need someone to own them. BI tools at that tier require procurement and onboarding cycles.
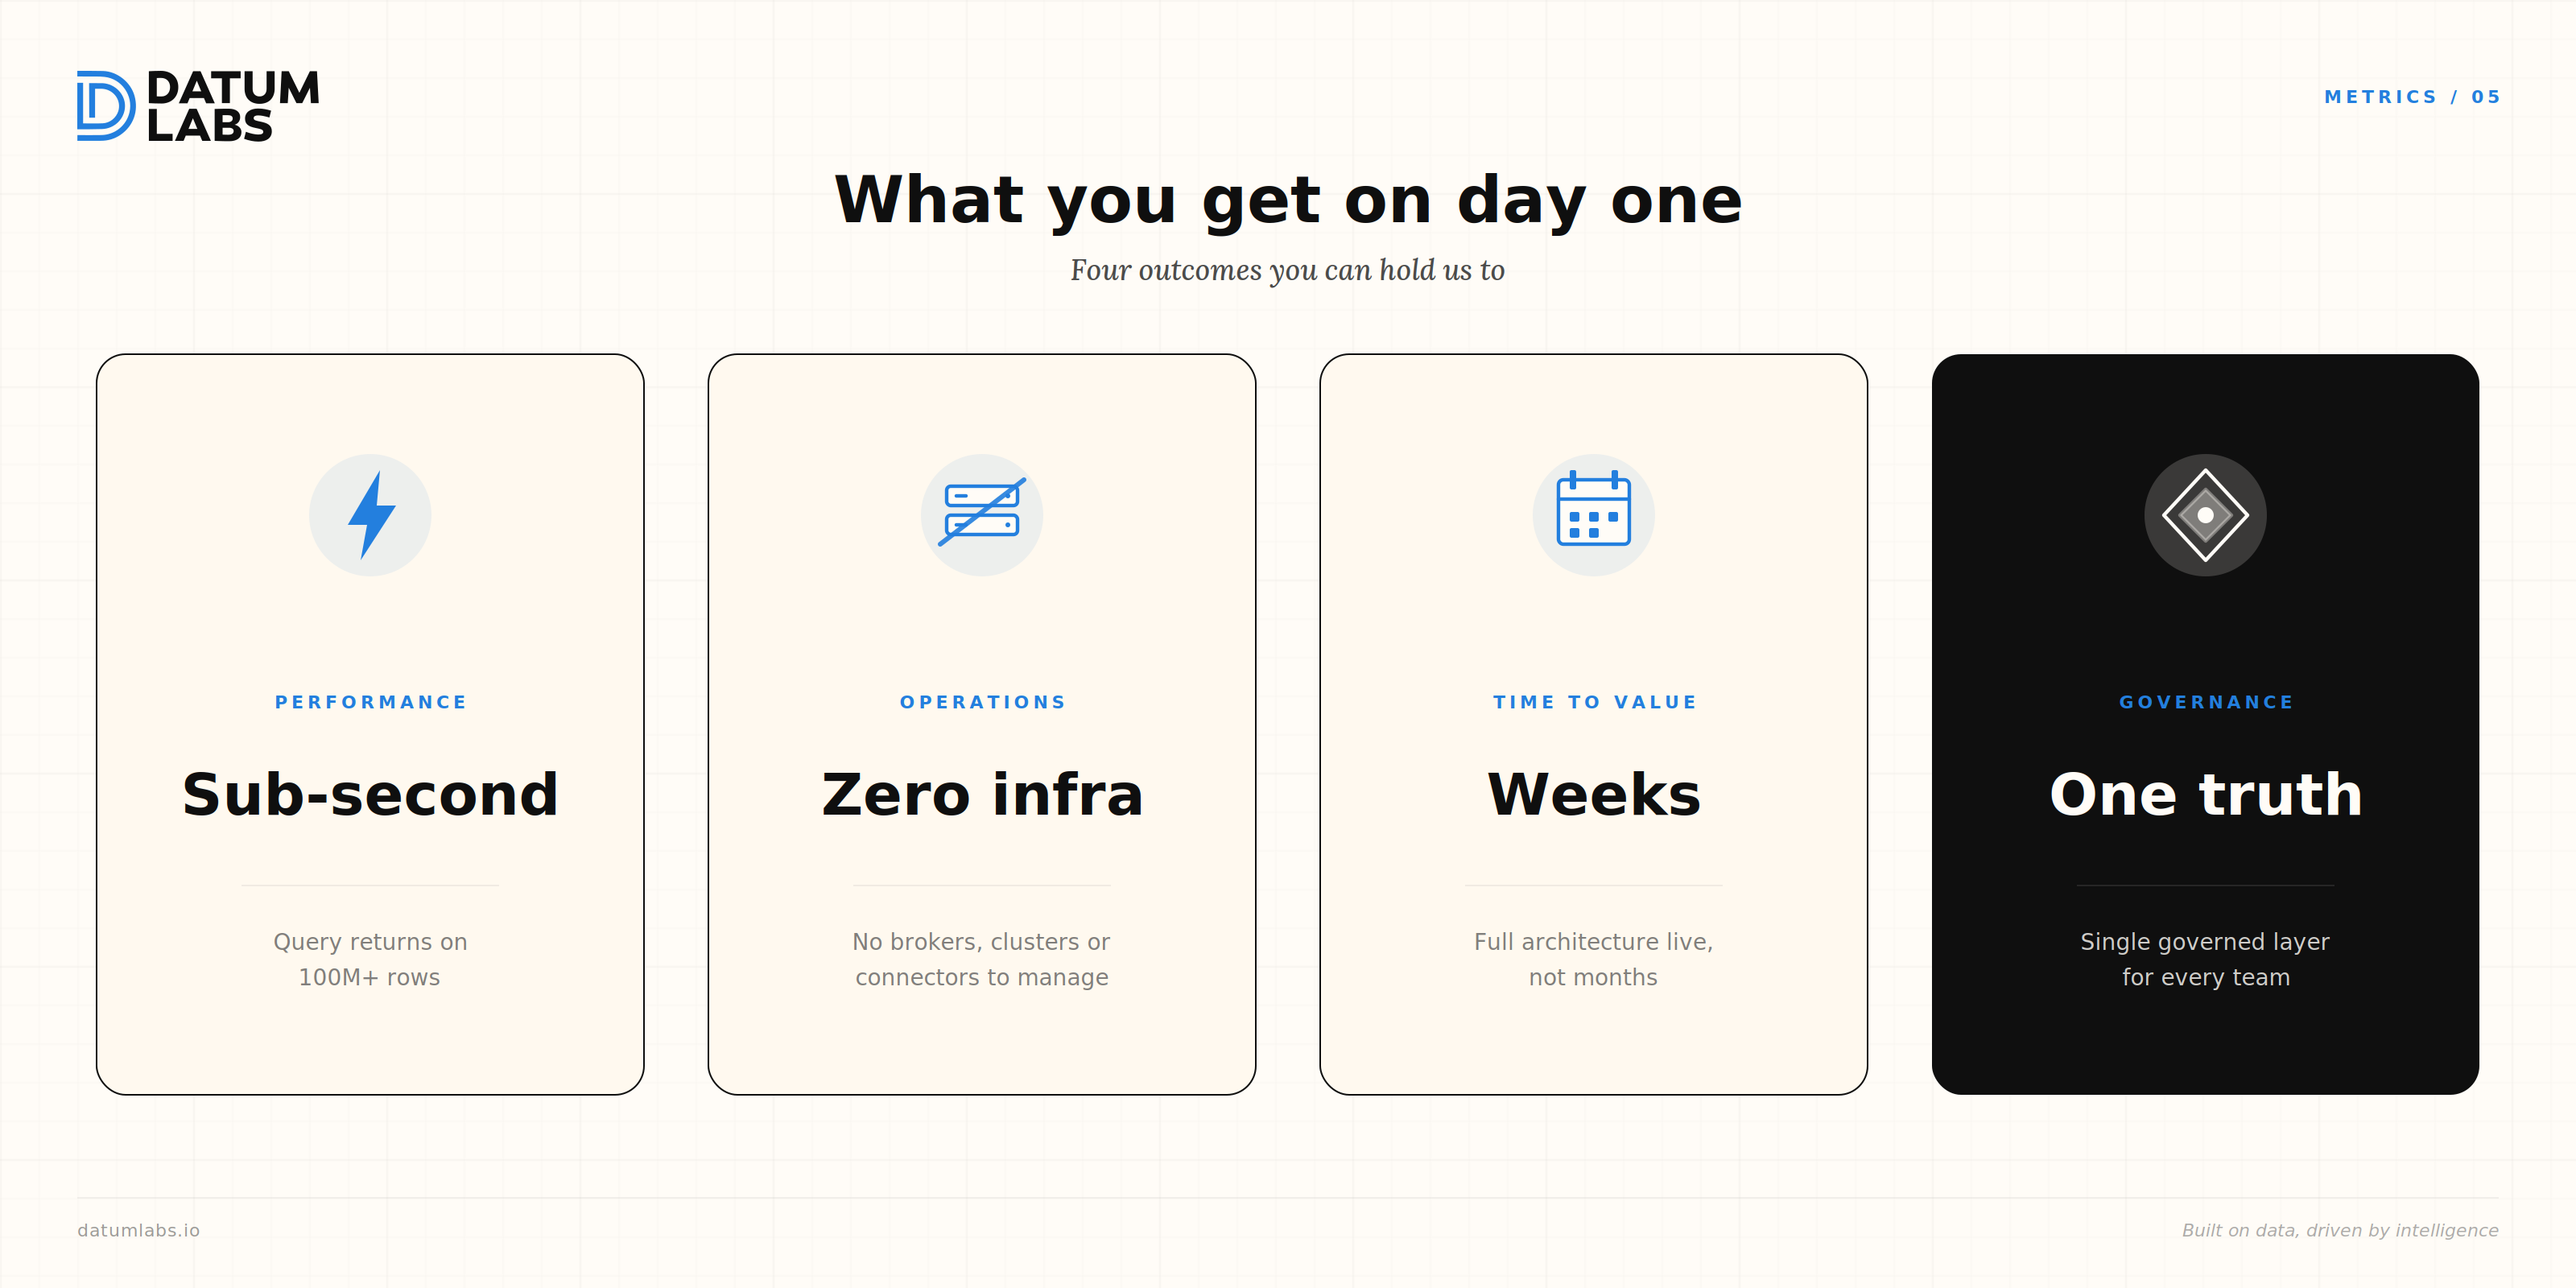
Amanahfy did not need an enterprise data platform. They needed something proportional to their actual problem: a fast, governed, queryable warehouse that their team could use without becoming infrastructure operators.
The architecture we designed was built around a single governing constraint: no self-hosted infrastructure. Everything runs managed. Everything scales automatically. The team interacts with data, not with servers.
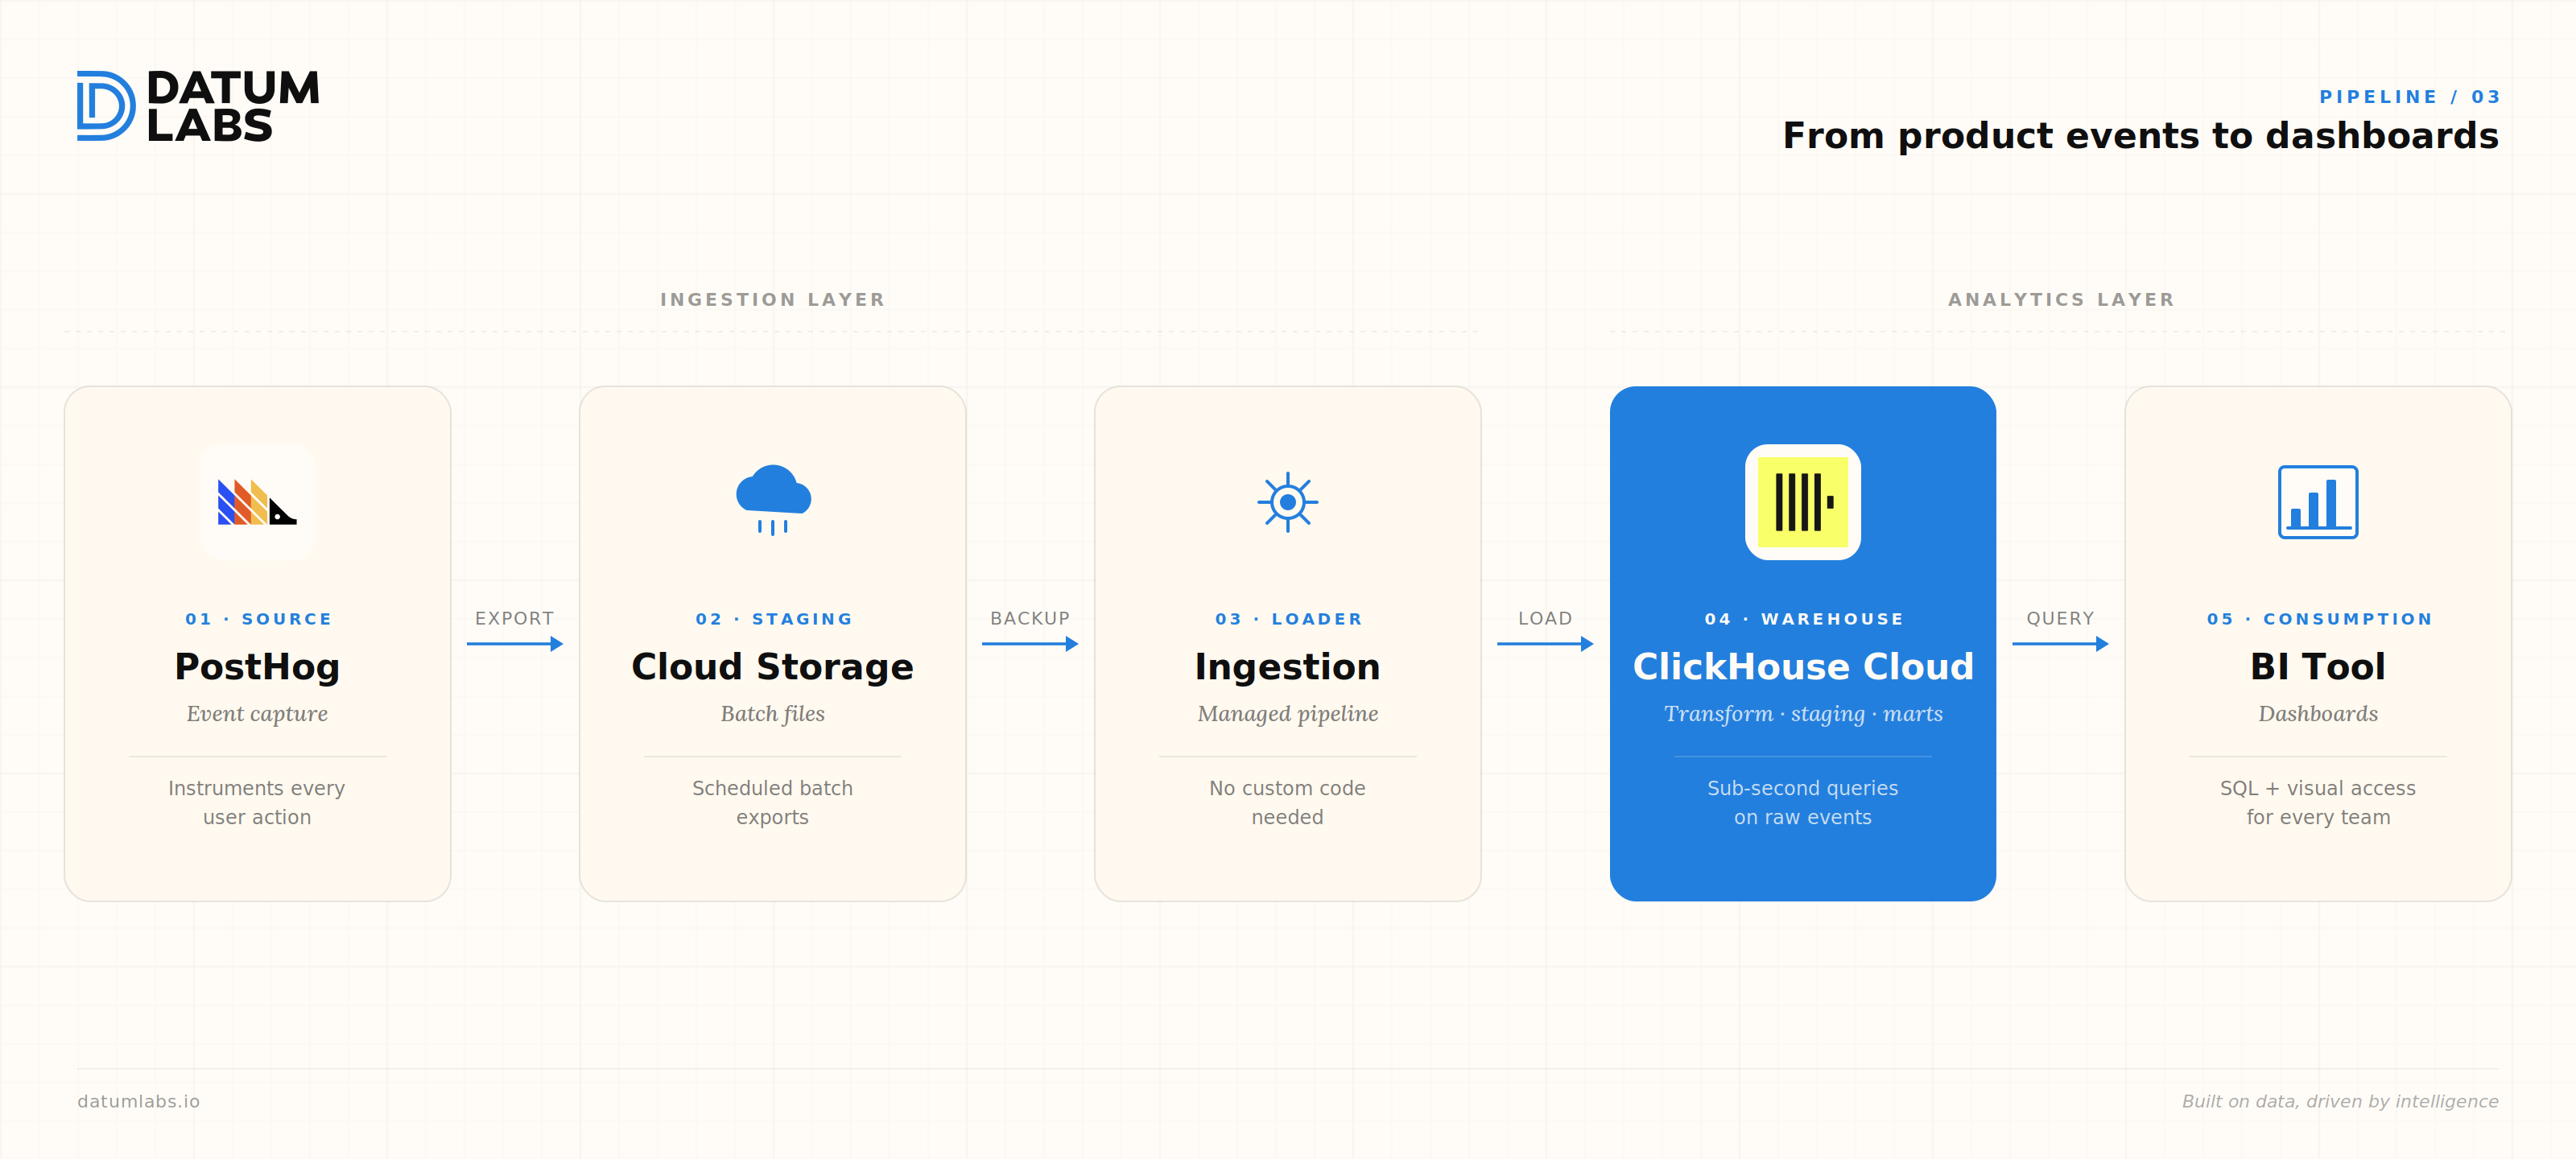
ClickHouse Cloud serves as the warehouse. It is the right choice here because ClickHouse is built specifically for analytical queries on large volumes of event data. Queries that would time out or require sampling in a general-purpose warehouse return results in seconds against ClickHouse, even on hundreds of millions of rows.
The ingestion layer works as follows. The existing analytics tool exports event batches to cloud storage on a regular schedule. A managed ingestion service picks those files up automatically and loads them into raw ClickHouse tables. There is no custom connector code to write or maintain. There is no streaming infrastructure to operate. The pipeline runs in the background without requiring attention.
On top of the raw event tables, a structured transformation layer processes data into clean, business-ready models. The approach uses incremental logic throughout. Because product event data is append-only, each transformation run only needs to process new events rather than reprocessing the full history. This keeps compute costs predictable and run times short even as the dataset grows.
The final layer is the analytics surface itself. A BI tool connects directly to ClickHouse, giving business users a clean dashboard experience for standard product metrics. Analysts who need to go deeper write SQL directly against the mart tables. Both surfaces draw from the same governed data layer, which means product, growth, and engineering see the same numbers.
The engagement moved in three stages.
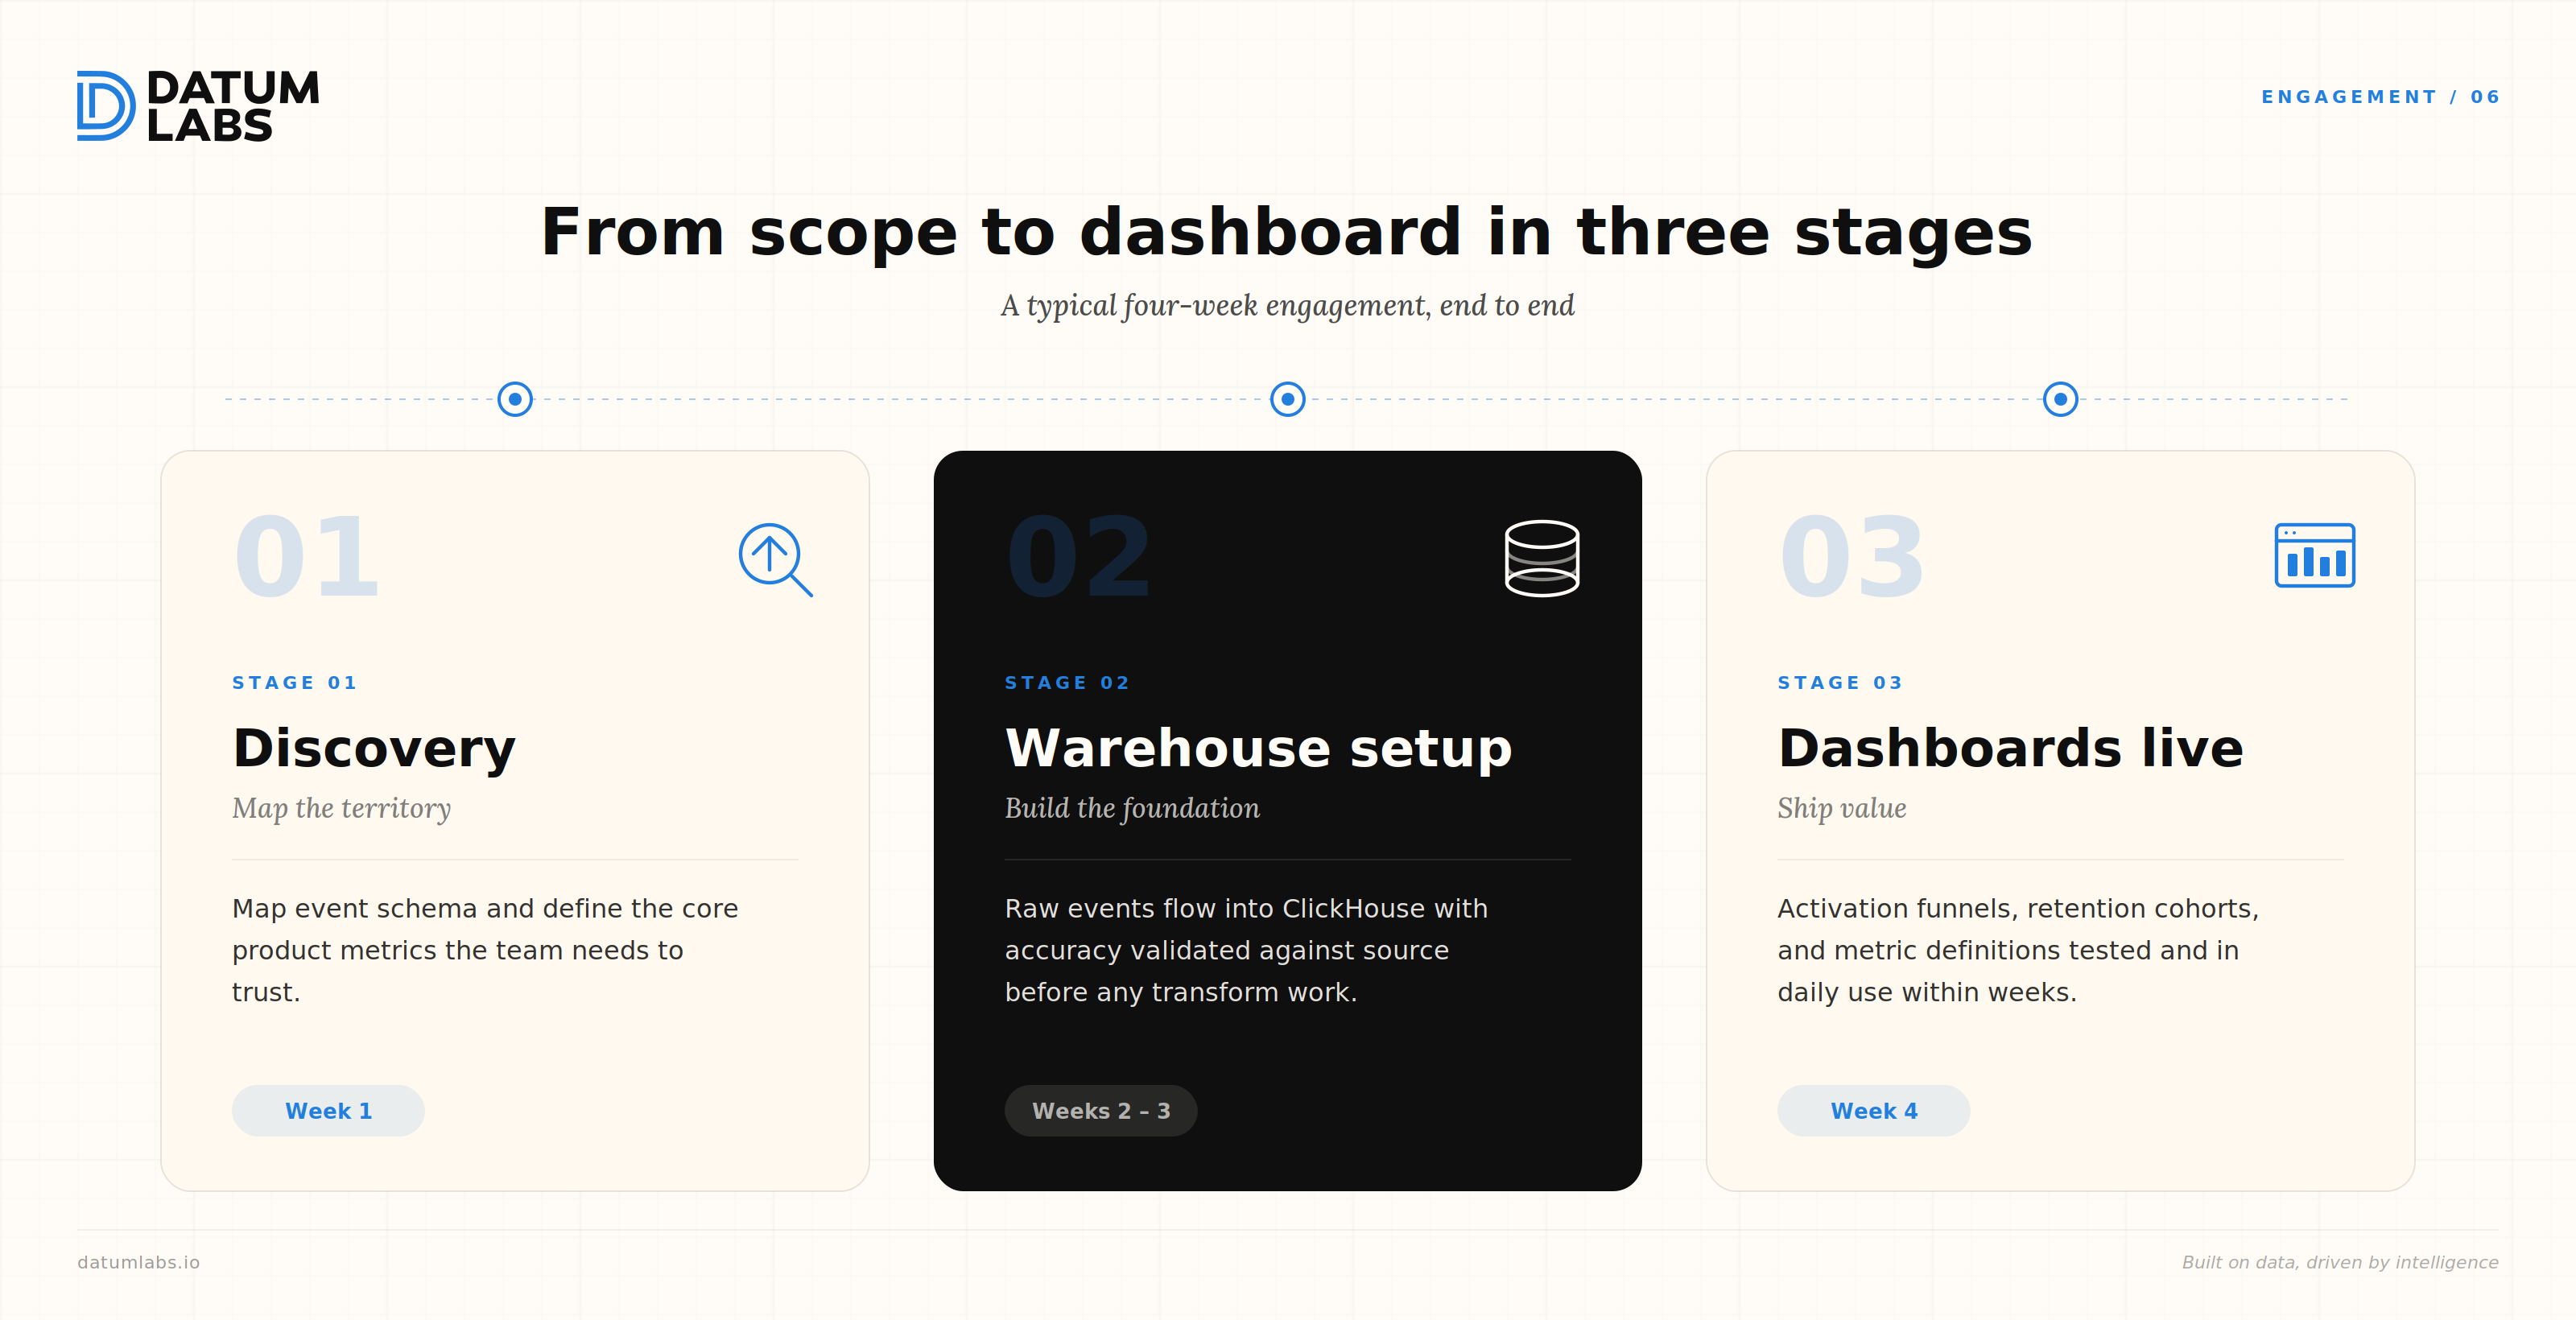
First, our team mapped the existing analytics setup, understood the event schema, and defined the core product metrics the team needed to trust. This was not a long discovery phase. The team had a clear sense of what they needed. The work was about translating that into a data model.
Second, the ingestion and warehouse layers were stood up and validated. Raw events began flowing into ClickHouse. Data accuracy was checked against the source system before any transformation work began.
Third, the transformation layer was built incrementally, starting with the metrics the team used most frequently — activation rates, feature adoption funnels, retention cohorts — and expanding from there. Dashboards were connected once the underlying models were stable and tested.
The full architecture was live and in daily use within a few weeks.
The difference was not subtle.
Before, answering a product question meant navigating the limitations of the native query interface, waiting for a scheduled export, or asking engineering for a manual data pull. Every approach had friction. None of them allowed the spontaneous, exploratory analysis that good product work requires.
After the new architecture was in place, the experience changed:
Nobody on the team manages infrastructure. There are no query limits to work around. When event volume grows, ClickHouse Cloud scales to match. When a new metric definition is needed, it is a pull request to the transformation project, not a conversation with a vendor.
The stack is intentionally simple. That simplicity is a feature, not a limitation. It means the team owns their data foundation without being burdened by it.

Ask AI for a summary about Datum Labs
We turn complex data into clear insights. Our comprehensive data analytics services, from strategy to execution, drive business growth and innovation.